
- Empowering your Financial Journey: 10 Must-Read Books for every Wealth Seeker - April 18, 2024
- Transforming Bad Financial Habits into Sustainable Behaviours - April 11, 2024
- How Prior Experiences and Beliefs Weave our Relationship with Money - April 4, 2024
Technical analysis is a methodology used by traders and investors to evaluate shares and market trends by analysing charts and technical indicators.. It is based on the assumption that all relevant information about a specific share or market is reflected in its price and volume data, and that patterns and trends can be identified and used to make informed trading decisions.
Fundamental Concepts of Technical Analysis
One of the fundamental concepts of technical analysis is the idea of support and resistance levels.
• Support levels: These are price levels where buying pressure is strong enough to prevent the price from falling further.
• Resistance levels: They are price levels where selling pressure is strong enough to prevent the price from rising further.
These levels can be identified by examining a share’s price chart and looking for areas where the price has previously bounced off or stalled at a certain level.
Trend Lines
Another important aspect of technical analysis is the use of trend lines. Trend lines are diagonal lines that are drawn on a price chart to connect the lows or highs of a trend. These lines can help traders identify the direction of the trend and provide a visual representation of the level of support or resistance that the trend is encountering.
Technical analysts also use a wide variety of indicators and oscillators to help identify potential trading opportunities. These indicators are typically based on mathematical formulas that analyse price and volume data to identify trends, momentum, and other important characteristics of a share or a market.
Most Commonly Used Indicators in Technical Analysis
Some of the most commonly used indicators in technical analysis include moving averages, relative strength index (RSI), stochastic oscillator, and Bollinger Bands.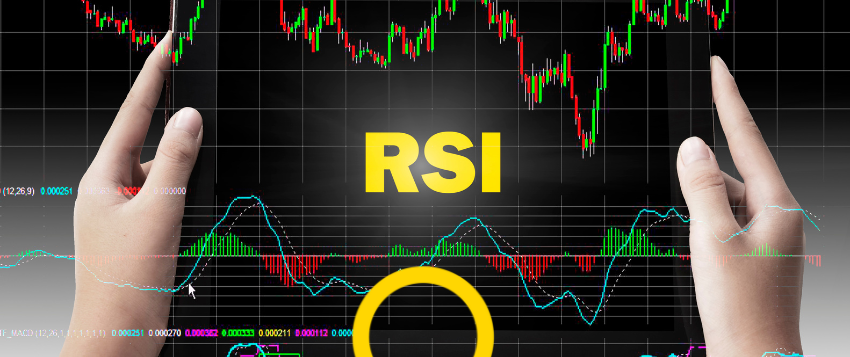
Moving averages are used to smooth out price fluctuations and identify trends, while the RSI and stochastic oscillator are used to identify overbought or oversold conditions that may indicate that a reversal is imminent.
Bollinger Bands are a type of indicator that uses a moving average and standard deviation to identify potential trading ranges for a share or market.
Chart Patterns
In addition to these indicators, technical analysts may also use chart patterns to identify potential trading opportunities. Chart patterns are formations that occur on a price chart and are based on the psychology of the market participants. Some common chart patterns include head and shoulders, double tops and bottoms, and triangles.
- Head and Shoulder Pattern
The head and shoulder pattern, for example, is formed when the price of a share rises to a peak and then declines, before rising again to a higher peak and then declining once more. The two peaks are called the “shoulders,” while the higher peak in the middle is called the “head.” The pattern resembles a human head and shoulders, hence the name.
- Double Tops and Bottoms Pattern
The double tops and bottoms pattern is considered a bearish reversal pattern, meaning that it is often followed by a decline in the price of the share. The pattern is formed when buyers are no longer able to push the price higher, and sellers begin to take control of the market. As the price declines, more sellers enter the market, leading to further declines.
Key Advantages of Technical Analysis
One of the key advantages of technical analysis is that it provides traders with a visual representation of market trends and price movements. By examining charts and other technical indicators, traders can quickly identify potential trading opportunities and make informed decisions about when to buy or sell a share. However, it is important to note that technical analysis is not fool proof and should be used in conjunction with other forms of analysis, such as fundamental analysis and market sentiment.
Conclusion
Technical analysis is a valuable tool for traders and investors who are looking to make informed decisions about the direction of a share price or market. While technical analysis is not a guaranteed method of making money in the markets, it can be a useful tool for those who are willing to put in the time and effort to learn how to use it effectively.
